Java Test Coverage Tool
The Java Test Coverage tool enables the collection and display of code coverage data on Java software source code bases of arbitrary size. It is a member of SD's family of Test Coverage tools.
Java Test Coverage Features
- Java1 and Java2 compatible, covering Java 1.1 to 1.6, Java 7 and Java 8
- Unlike byte-code instrumenters, it is not dependent on class file format
- Works with standalone applications or servlets
- Works with applications running on arbitrary JVMs (including embedded systems) or RealTime Java
- Works with arbitrary subsets of source code base
- Can accumulate data from multiple test runs
- Handles
tens of thousands of files - Extremely low probe overhead
- Complete control over which Java class files are profiled (test coverage tools using JVM facilities often must collect coverage information for every class regardless of your interests)
- Operations to combine Test Coverage data for unions, deltas, intersections
- Incremental insertion of probes
- Incremental reporting of which test cases need to be re-run based on code changes at the method level
- Produces coverage report by method, class, application, package and file. The coverage report can be exported as XML. Either summary can be produced in a batch script to enable test coverage in build scripts.
- The probe installer component runs on Windows
- Test Coverage data display can run on any platform with a full JVM
The extremely low space and time overhead of test probes used by the Java Test Coverage tool makes it ideal for working with embedded, realtime, or large server programs.
The Java Test Coverage tool has an intuitively simply display. It shows
- Possible test coverage vector (TCV) result files
- Selected/accumulated/computed TCV files
- List of files being tested for coverage
- Locations of probe points in files
- Browsable source text of file of current interest
- Covered/uncovered status of each probe point on file source text
- Summary statistics for percentage covered
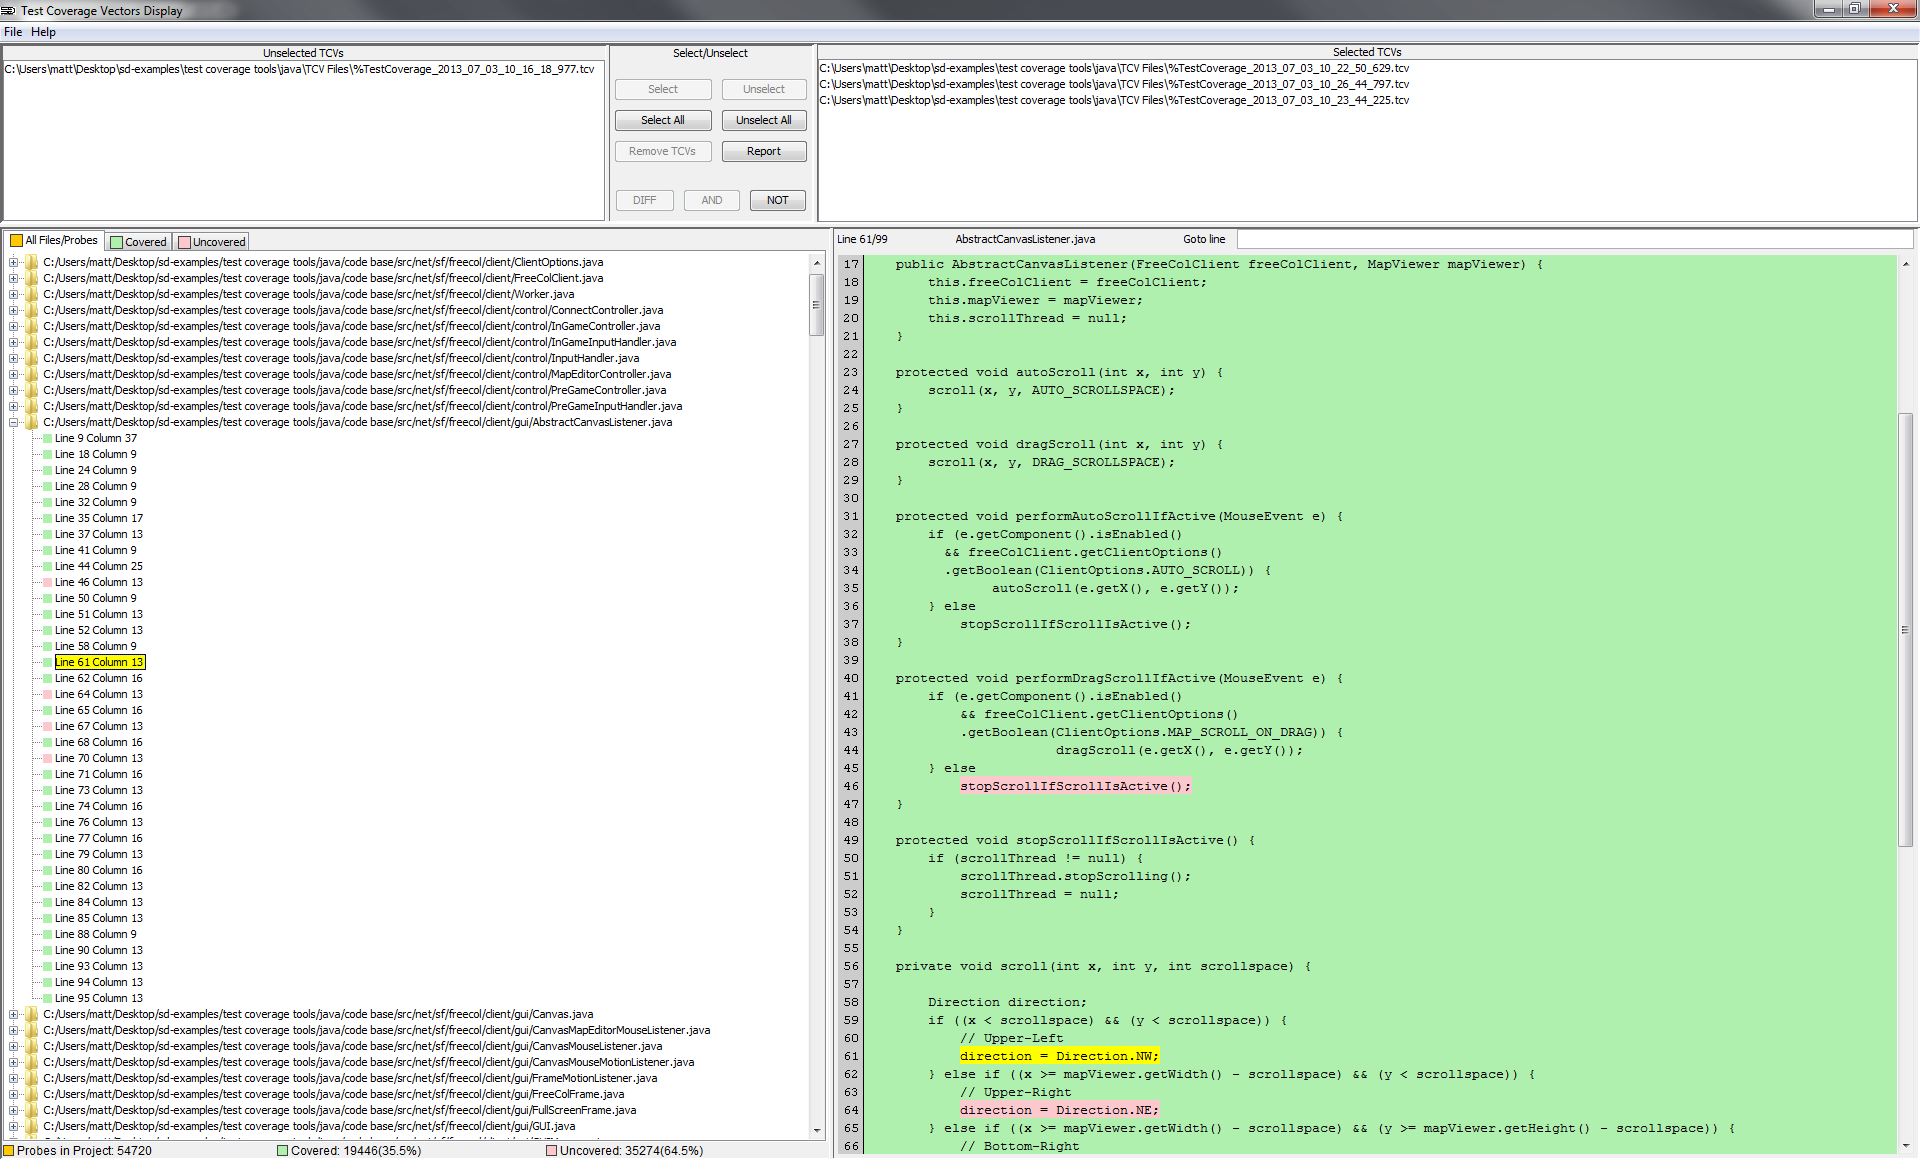
Here's a screenshot (in a popup window) of the Java Test Coverage display applied to a system of over 600 Java files (100,000 lines). If you have popups disabled, try this link: screen shot Green ("go") code has been covered/executed by some test; red ("stop") code has not been executed by any test.
Semantic Designs also offers Java Profiler Tools

)