C Profiler Tool
The C Profiler tool enables the collection and display of execution profile data on C software source code bases of arbitrary size. It is a member of SD's family of Profiler tools.
C Profiler Features
- Available for ANSI C 89, GCC3, or Microsoft VisualC6 (C99 available on request)
- Provides execution counts on basic blocks, or timing profiles on methods
- Not dependent on compiler or specific object format
- Works with arbitrary subsets of source code base
- Can accumulate data from multiple test runs
- Handles
tens of thousands of files - Extremely low probe overhead both in time and space
- Produces profile report by application, package and file
- Profile data collection can run on platform separate from Profile tool
- User-customizable probe implementation/coverage data extraction enables operation with unusual embedded systems
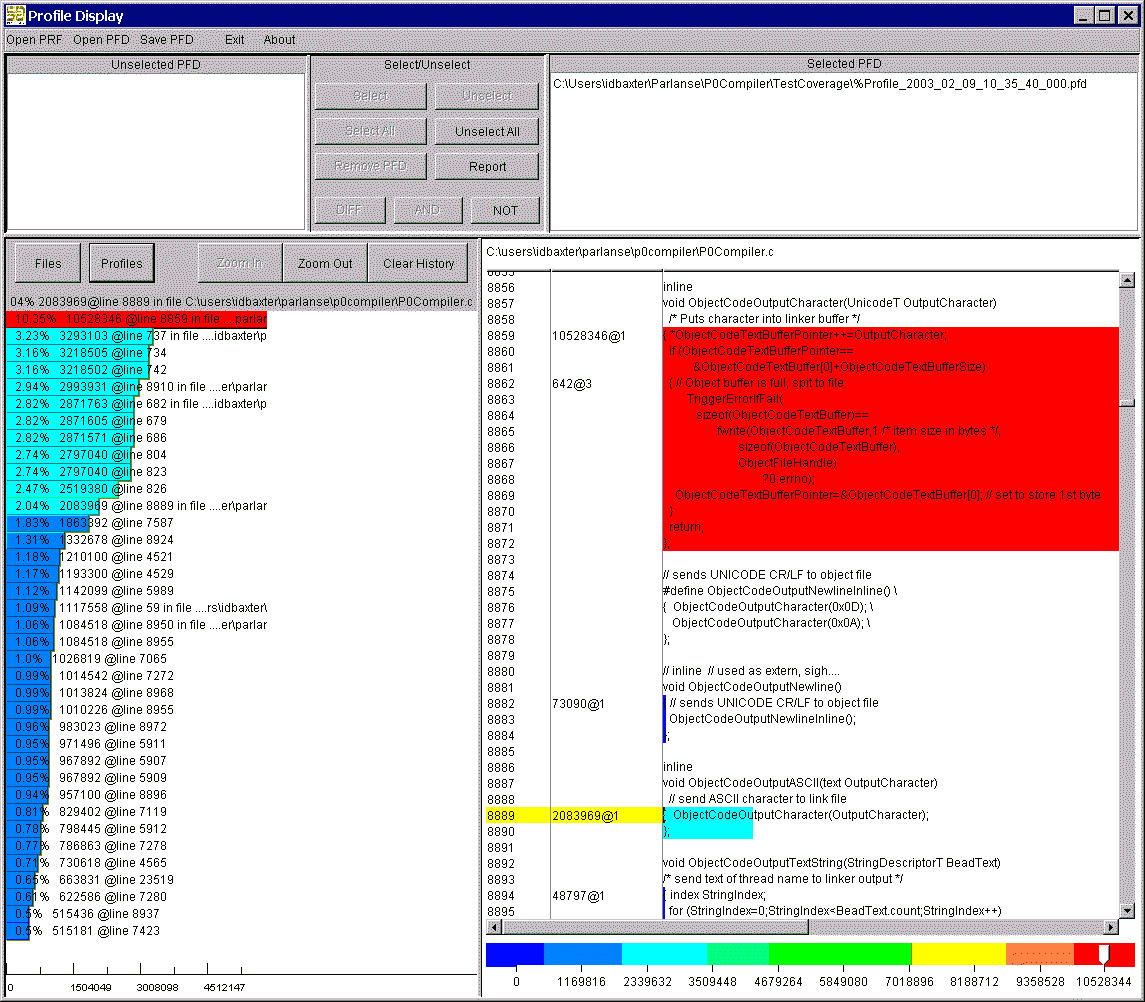
The C Profiler tool has an intuitively simply display. It shows
- Possible Profile Data (PFD) result files
- Selected/accumulated/computed PFD files
- List of files for which profile data is being collected
- Locations of probe points in files
- Browsable source text of file of current interest
- Execution counts and relative frequency of each probe point on file source text
- Color- and size- coded (hot is red and wide, cold is blue) overlay of frequency data on source code
- Summary statistics for each subsystem

Here's a full size screenshot (in a popup window) of the C Profiler display. If you have popups disabled, try this link: full size screen shot.
Have a nonstandard dialect of C or a custom C compiler? Semantic Designs can economically configure a Profiler tool for it.
Semantic Designs also offers C Test Coverage Tools
